Frome's Rental Market: A Decade of Change
The private rented sector in [Grantham] has undergone some noticeable shifts over the last ten years, with different areas experiencing varying levels of growth, stability, and decline.
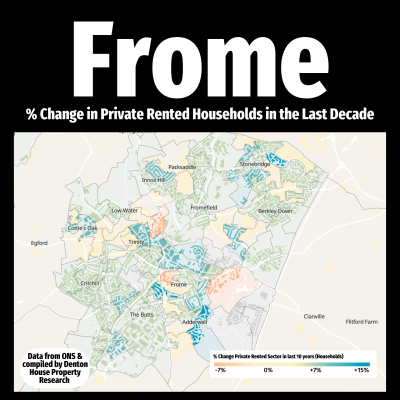
🔵 Growth Areas – The blue-shaded sections on the map indicate an increase in private rented households. A rise in supply of rental properties, potentially driven by affordability, lifestyle changes, or an influx of tenants looking for flexibility.
⚪ Stable Areas – The cream-coloured zones represent little to no change in rental levels. Here, the balance between landlords, tenants, and owner-occupiers has remained steady over the decade.
🟠 Declining Areas – The peach-coloured regions highlight a drop in private rented households. This could be due to landlords selling up, shifting market conditions, or an increase in owner-occupation.
Understanding these patterns is key for [Grantham] landlords, investors, and agents. The rental market is always evolving, shaped by policy changes, economic shifts, and tenant preferences. Whether you're expanding your portfolio, reevaluating your strategy, or simply curious about local trends, this data offers valuable insight into where the market is heading.
Feel free to call [me/us] on [insert number]


