Latest Property News
- Details
- Hits: 307

Frome’s Ageing Population Turning to Rentals: What it Means for Landlords.
Recent figures from the Office for National Statistics reveal that across the UK, 486,795 households are occupied by individuals aged 65 (and over) who live in a private rental sector home. This represents that 6.71% of all OAP’s now renting privately.
Ten years ago, only 267,704 households were occupied by individuals aged 65 (and over) that lived in private rental sector home, (which represented just 4.39% of all older adults).
- Details
- Hits: 231

£ per square foot November 2024
Welcome back to news of Frome's property market, where each week we bring you different local property market stats and trends. This week we are back again with the November's £/sq.ft statistics.
The average property presently in Frome is on the market for £358 per square foot, a figure representing the current heartbeat of Frome's property market.
- Details
- Hits: 237
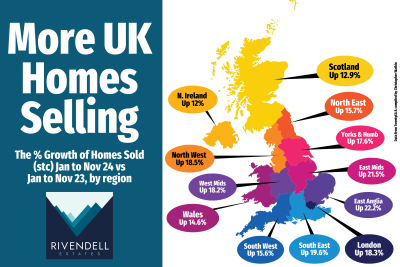
UK Property Market Sees Positive Growth in 2024 – But Challenges Remain
The UK property market is showing signs of strength, with a remarkable increase in homes marked as ‘sold subject to contract’ (SSTC) between January and November 2024 compared to the same period in 2023.
This upward trend in every region across the country, reflects renewed confidence among buyers and sellers.
- Details
- Hits: 246
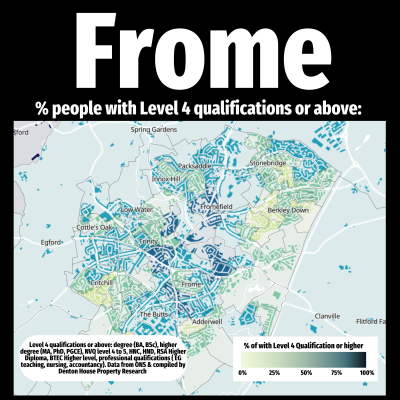
% of People with Level 4 Qualifications or Above
The map of Frome highlights the distribution of residents with Level 4 qualifications and above. Level 4 including degrees, higher degrees, and professional qualification. This is all based on data from the Office for National Statistics and the recent Census. This data offers a fascinating insight into the educational profile of our community and serves as a valuable resource for understanding Frome's diversity.
Educational qualifications can often reflect broader trends, including employment types, income levels, and the services valued by residents. For local businesses, organisations, and estate agents, this information is particularly relevant. It can provide clues about the type of housing, amenities, and services that might appeal to different areas of the community.
- Details
- Hits: 244
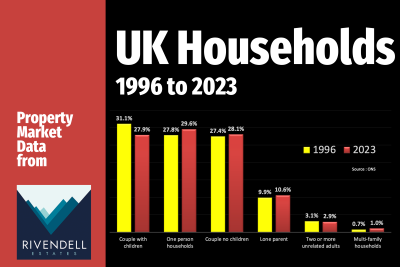
UK Households 1996 to 2023
The composition of UK households has evolved significantly between 1996 and 2023, with some subtle yet meaningful proportional shifts that reflect changing demographics and societal trends.
For couples with children, their share of total households has dropped from 31.1% in 1996 to 27.9% in 2023, a proportional decrease of approximately 10.3%. This reflects lifestyle changes, including delayed parenthood and smaller family sizes.


