Latest Property News
- Details
- Hits: 126
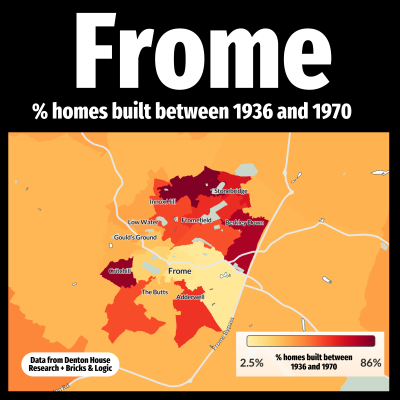
Understanding Frome's Mid 20th Century Homes
This map highlights the percentage of homes in Frome built between 1936 and 1970. The darker shades indicate a higher proportion of homes from this era and lighter shades showing areas with fewer properties built during this time.
Homes constructed in this period tend to be well built and practical, often featuring spacious layouts and generous gardens compared to more modern developments. While they may not always boast the architectural charm of Georgian period homes or the size of Victorian homes, they are undeniably solidly constructed, offering excellent long-term value.
- Details
- Hits: 127
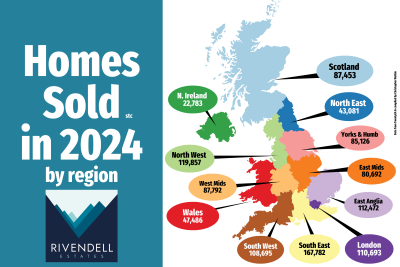
Strong Start to 2025 for UK House Sales – But Realistic Pricing is Still Key
January kicked off with a strong performance in most parts of the UK housing market, with the number of homes sold subject to contract rising in every region except Northern Ireland.
However, while demand is strong, sellers must remain realistic—only 53% of homes listed in 2024 resulted in a completed sale, meaning 47% of sellers took their property off the market without finding a buyer.
- Details
- Hits: 135

How will the interest rate cut affect the Frome property Market?
The Bank of England has reduced interest rates to 4.5%, marking its third cut in under a year. This decision follows a previous reduction in November 2024, with the rate remaining unchanged in December. While most of the Bank’s nine policymakers supported the move to 4.5%, a minority favoured a more aggressive cut to 4.25%, highlighting the ongoing uncertainty surrounding the UK economy.
- Details
- Hits: 173
How Long Does It Take to Sell a Home in Frome?
If you’re a homeowner in Frome thinking of selling your property, you have probably wondered how long it will take to find a buyer.
The timeline for selling a home varies depending on factors such as property type, price, and market conditions. Fortunately, we’ve compiled the latest statistics for 140 Frome homes that have sold stc in the last 3 months, split down by type (detached houses, semi-detached homes, terraced houses, and flats) to give you a clear picture.
- Details
- Hits: 137
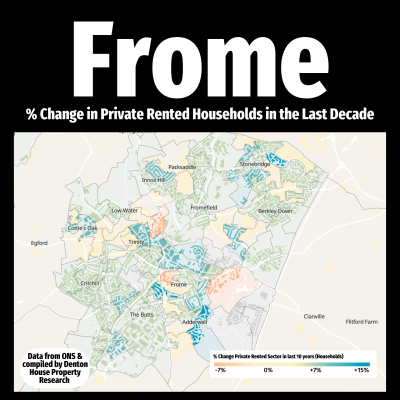
Frome's Rental Market: A Decade of Change
The private rented sector in [Grantham] has undergone some noticeable shifts over the last ten years, with different areas experiencing varying levels of growth, stability, and decline.
🔵 Growth Areas – The blue-shaded sections on the map indicate an increase in private rented households. A rise in supply of rental properties, potentially driven by affordability, lifestyle changes, or an influx of tenants looking for flexibility.
⚪ Stable Areas – The cream-coloured zones represent little to no change in rental levels. Here, the balance between landlords, tenants, and owner-occupiers has remained steady over the decade.
🟠 Declining Areas – The peach-coloured regions highlight a drop in private rented households. This could be due to landlords selling up, shifting market conditions, or an increase in owner-occupation.


