Latest Property News
- Details
- Hits: 64
Will Your Home Sell? The Stats Every Frome Homeowner Needs to Know
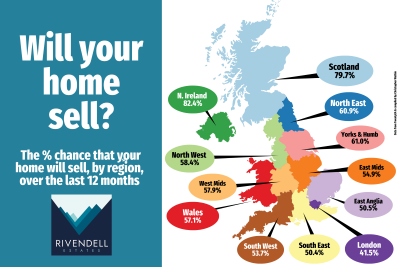
Over the past 12 months, 1,579,728 homes have left the UK estate agents books. Of these, just 870,498 properties (55.1%) successfully reached exchange and completion (ie the homeowner moved) – meaning that 44.9% (709,230 homes) were withdrawn unsold.
However, the likelihood of selling varies significantly depending on where you live. Northern Ireland leads the way with an 82.4% success rate with London, however, siting at the bottom of the table, with just 41.5% of homes completing.
- Details
- Hits: 89
Why Does it Take 117 Days to Move into a Frome Home?
Buying or selling a home is often one of the most significant transactions people make, yet the process in England and Wales remains frustratingly slow. You find the home of your dreams, you make an offer, it is negotiated, and a price is agreed. Yet once a sale is agreed, it takes an average of 118 days—nearly 17 weeks—for legal completion to take place for a home in the UK. That’s more than four months of uncertainty, stress, and potential financial risk for buyers and sellers alike.
- Details
- Hits: 83
UK Property Market Showing Strong Start in 2025
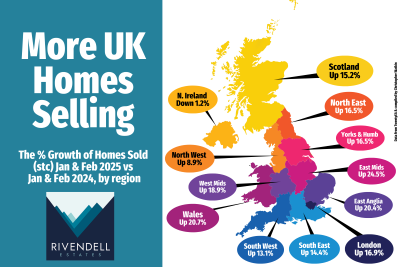
The property market has kicked off 2025 with a surge in home sales across most UK regions. Comparing the number of homes sold subject to contract in the first eight weeks of 2025 with the same period in 2024, the data shows an impressive rise in buyer activity.
Leading the charge is the East Midlands, with a 24.5% increase in sales. Wales (20.7%) and East Anglia (20.4%) are also seeing remarkable growth, alongside the West Midlands (18.9%).
- Details
- Hits: 88
Thinking of Moving Home in Frome? Here’s Where the Bigger Homes Are
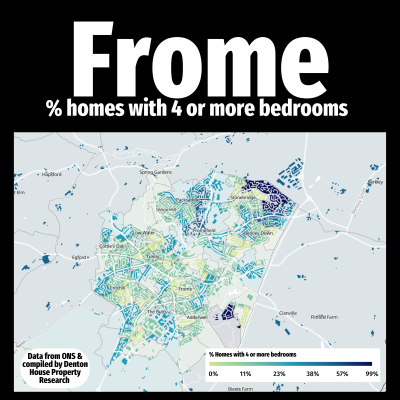
If you're considering a move and space is a top priority, understanding where larger Frome homes are clustered can be incredibly useful.
This map highlights the distribution of four-bedroom (or larger) properties across the local Frome market, giving a clear picture of where they are more commonly found.
Larger Frome homes often appeal to growing families, those needing extra space for home offices, or buyers looking for long-term flexibility. On the flip side, if you already own a spacious Frome home and are thinking of downsizing, knowing where demand for bigger properties is highest can help you plan your next steps.
- Details
- Hits: 104
Frome House Price Review: The February 2025 Update
Frome homeowner or landlord? Curious about the trends in the Frome property market? One measure is the average price paid for homes bought and sold in Frome in the last 12 months, on a rolling month by month basis.
Each month I like to share this figure, and whilst this figure alone will not tell you much, its trend will. My followers on social media know I write regular articles on the Frome property market. It is in those articles I expand and clarify what these monthly figures mean to you.


